30 Etsy Listing Photo Infographics: What Most Sellers Get Wrong and How to Fix It
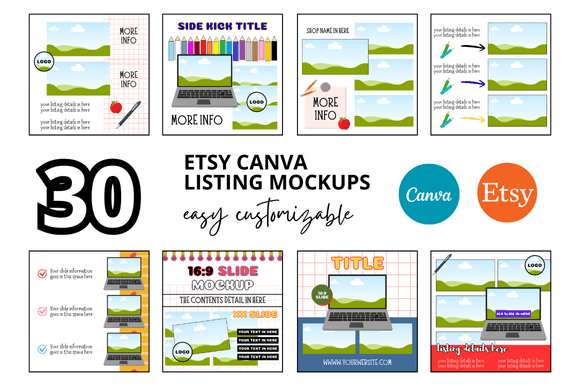
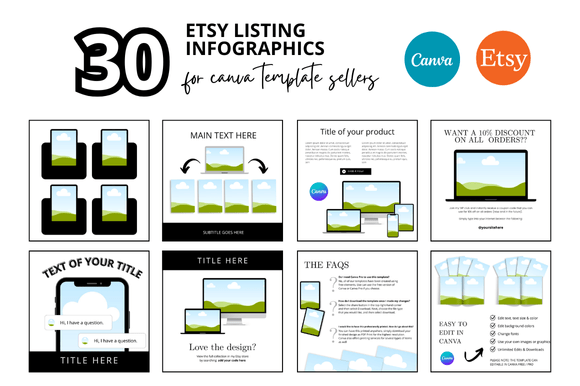
If you sell on Etsy, you already know that photos make or break a listing. But there is a difference between simply having images and having images that genuinely sell. That is where 30 Etsy listing photo infographics come in. This concept refers to a structured set of graphic-driven visuals designed to present product features, size guides, material details, usage ideas, and comparison charts in a format that buyers can absorb quickly. Many sellers turn to infographics because they want to reduce questions, build trust, and stand out in search results. But the tool is only as effective as the way it is used.
Having reviewed hundreds of Etsy shops and worked with sellers at every experience level, I have noticed recurring patterns that hold people back. The mistakes are not about lack of effort. They are about misunderstanding what an infographic is supposed to do inside a listing. This article walks through the most common missteps, why they hurt your results, and what to do instead.
Confusing Decoration with Communication
The most frequent error sellers make is treating infographics as pretty add-ons rather than functional communication tools. A listing photo infographic is not a wallpaper. It is not there to fill space or make the listing look more polished. Its job is to answer a specific question the buyer has before they feel comfortable clicking Add to Cart.
When you design or select a set of 30 Etsy listing photo infographics, ask yourself what each one actually says. If the graphic is heavy on decorative elements but light on useful information, it is probably working against you. Buyers scan quickly. If they cannot find the answer they need within a couple of seconds, they move on.
A better approach is to map each infographic to a real buyer concern. For example, if you sell ceramic mugs, one infographic should clearly show dimensions and capacity. Another should explain microwave and dishwasher safety. A third might show the mug next to a standard coffee cup for scale. Do not assume buyers will infer these details from a product photo. Spell them out visually.
Overloading Every Graphic with Information
The opposite problem is just as common. Some sellers try to cram every detail about their product into a single infographic. The result is a dense block of text, tiny icons, and overlapping elements that nobody reads. An infographic that requires effort to decode will be ignored.
Even within a complete set of 30 Etsy listing photo infographics, each individual graphic should focus on one or two key points. If you have multiple things to say about materials, sizing, care, and shipping, spread those across separate images. Let each infographic breathe. White space is not wasted space. It gives the buyer’s eye a place to rest and makes the information feel accessible.
When reviewing your own set, look at the text-to-visual ratio. If any single infographic contains more than three short lines of text, consider splitting the content. Remember that Etsy’s mobile app shrinks images significantly. What looks readable on your desktop monitor may become illegible on a phone screen.
Ignoring the Etsy Canvas Constraints
Every platform has quirks, and Etsy is no exception. Listing photos are displayed in a square or near-square aspect ratio by default, and the thumbnail crop can cut off critical content if you are not careful. This is especially relevant when you are working with a collection of 30 Etsy listing photo infographics. You may be tempted to use a vertical or horizontal layout that matches your brand aesthetic, but if it does not fit Etsy’s display parameters, you will lose visibility.
Before finalizing any infographic, test it in a mockup of Etsy’s search results and listing page on both desktop and mobile. Ensure that key text, logos, and measurement callouts remain visible even when the image is cropped to a square. If you need to use a non-square layout, center your most important information in the middle of the frame so it survives the crop.
Another overlooked constraint is file size. Etsy allows images up to a certain resolution, but large files slow down page load speed. Buyers will not wait for a heavy graphic to render. Optimize your infographics so they are crisp on a Retina display without bloating the file size. Tools like TinyPNG or Photoshop’s export for web option can help you strike that balance.
Using Inconsistent Visual Language
Consistency builds trust. When a buyer scrolls through your listing and sees one infographic with a modern sans-serif font, another with a script font, and a third with mismatched color accents, it signals disorganization. This happens often with sets of 30 Etsy listing photo infographics because sellers piece them together from different templates or designers.
If you are purchasing a pre-made set, check that all graphics use the same color palette, font family, icon style, and layout structure. If you are creating your own, establish a simple style guide before you start. Write down which fonts you are using, which hex codes represent your brand colors, and how much padding each element should have. Refer back to that guide for every single graphic.
Consistency also applies to the tone of the text. If one infographic uses casual language like “fits perfectly in your bag” and another uses technical jargon like “dimensions: 12 x 8 x 4 cm,” the buyer may wonder if they are looking at the same product. Match the voice across all graphics. Technical details are fine, but keep the phrasing consistent so the set feels cohesive.
Neglecting the Buyer’s Reading Order
Etsy listings allow you to arrange your photos in any order. This is a powerful feature that many sellers underutilize. The sequence of your 30 Etsy listing photo infographics should tell a story, not just dump information randomly. Buyers usually want to see the product first, then understand its features, then check sizing and materials, and finally review policies or shipping details.
Put your most compelling infographic in position one or two, right after the hero product photo. That is where buyer attention is highest. Use that slot to immediately answer the question most likely to stop a purchase. If you sell handmade candles, for example, lead with an infographic that shows burn time, scent notes, and safety instructions. If you sell clothing, lead with a size chart or fit guide.
A common mistake is burying essential information in the middle or end of the image set. If the buyer has to swipe through ten graphics to find out whether your item ships internationally, you have already lost them. Prioritize information by importance, not by design convenience.
Overlooking Accessibility and Readability
Readability is not just about font size. It is about contrast, spacing, and clarity. Light gray text on a white background may look elegant in a design portfolio, but on Etsy it is a liability. Buyers browse in various lighting conditions and on various screen qualities. Your infographics need to hold up under all of them.
When evaluating a set of 30 Etsy listing photo infographics, check every element for sufficient contrast. Use a tool like WebAIM’s contrast checker to confirm that your text meets accessibility standards. Avoid placing text over busy background patterns. If you must use an image as a background, add a semi-transparent overlay behind the text to keep it legible.
Another aspect of readability is icon interpretation. Not every buyer will understand an abstract icon at a glance. If you use a symbol to represent “machine washable,” consider adding a short text label underneath. Relying solely on iconography can confuse international buyers or those unfamiliar with standard icon sets.
Buying a Set Without Customization
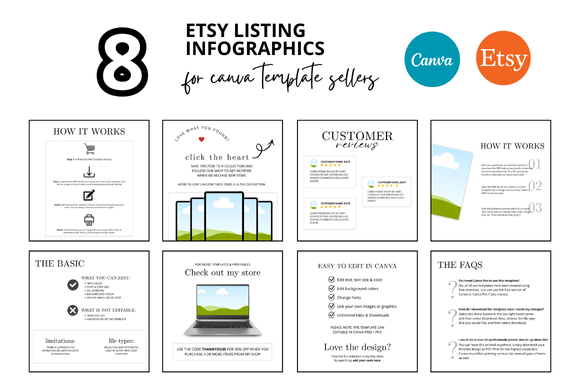
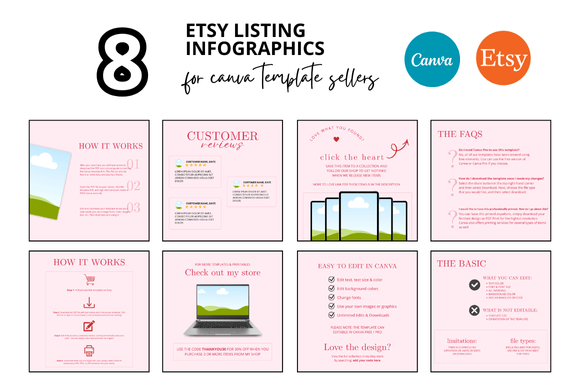
Pre-made infographic sets are convenient and affordable, and they can save hours of design work. But using them straight out of the box without any customization is a missed opportunity. Your product has unique selling points that a generic template cannot fully capture. Even a small tweak, like changing the example measurements to match your exact product dimensions, makes a significant difference.
If you purchase a collection of 30 Etsy listing photo infographics, go through each one and ask: “Does this say something true and specific about my product?” If the answer is no, either edit the text or remove the graphic entirely. A generic infographic that could apply to a hundred different products does not build trust. It feels like filler.
Customization does not have to be expensive. You can edit text directly in Canva, Photoshop, or even a free tool like Photopea. Change the product name, adjust the measurements, and swap out any stock photos for images of your actual item. The time you spend on this step directly improves your conversion rate.
Ignoring the Relationship Between Infographics and Reviews
One subtle but powerful way to use your infographics is to proactively address common complaints or questions that appear in your reviews. If you notice multiple buyers asking about sizing, or if a few reviews mention that the product was smaller than expected, create an infographic that directly addresses that concern. Include a photo of the item next to a ruler, a common object like a phone, or a person wearing it.
This approach is especially effective when you have a full set of 30 Etsy listing photo infographics because you can afford to dedicate one or two graphics specifically to objection handling. Buyers who see their doubts addressed before they purchase are far more likely to complete the transaction and less likely to leave a negative review later.
Treat your infographics as a conversation with the buyer. If they are asking the same question over and over in messages, that is a clear signal that your current photos are not answering it. Add an infographic that fills that gap.
Using Infographics as a Replacement for Good Product Photography
This may be the most important correction to make. Infographics are supplements, not substitutes. No amount of well-designed graphics can make up for blurry, poorly lit, or uninformative product photos. Buyers need to see what the actual item looks like in real-world conditions. They need multiple angles, close-ups of texture, and lifestyle shots that show scale and context.
Even the best set of 30 Etsy listing photo infographics will underperform if the primary photos are weak. Use infographics to support your product images, not to replace them. A good rule of thumb is to have at least one infographic for every two or three product photos. Keep the balance tilted toward real photography, and use infographics to clarify and reassure.
What to Check Before You Commit to a Set
Before you buy, download, or design a collection of 30 Etsy listing photo infographics, run through this quick checklist. First, confirm the file format. Most sellers need JPEG or PNG files that are at least 3000 pixels on the longest side for sharp Etsy display. Second, verify that the set includes editable templates if you plan to customize. If you are buying from a designer, ask about licensing. Some sets are for personal use only and cannot be used on a commercial shop without additional fees.
Third, look at the variety of infographic types included. A good set should cover dimensions, materials, care instructions, packaging details, shipping policies, and usage ideas. If the set leans heavily on decorative quotes or inspirational text, it is probably not built for selling. Fourth, read the return policy. Digital products are usually non-refundable, but a reputable seller will offer support or replacement files if there is a technical issue.
Finally, test one or two graphics in your actual listing before committing to the full set. Upload them, preview the listing on a phone, and ask a friend to look at it without any context. If they can correctly describe the product and its key features after looking at the infographic, you are on the right track.
Moving Forward with Confidence
Using infographics effectively is not about having more images. It is about having the right images arranged in the right order with the right information. The difference between a set of 30 Etsy listing photo infographics that converts and one that just takes up space is intentionality. Every graphic should serve a purpose, answer a question, and build confidence.
Start by auditing your current listing photos. Identify the gaps where buyers get confused or ask questions. Design or source infographics that fill those specific gaps. Maintain consistent visual branding. Keep text minimal and legible. Test on mobile. And never forget that the product itself should always be the hero of the listing.
With a thoughtful approach, those 30 infographics become one of the most effective tools in your Etsy shop. They save you time answering messages, they reduce returns, and they help buyers feel informed enough to click Buy Now without hesitation. That is the goal worth aiming for.